In the spirit of my last post, I ran benchmarks and built prediction models of temperature in all Wallonia. It was a good way for me to be more familiar with mlr.
My models have been built from a benchmark run on 2 months.
Preparation of the benchmark
First, I had to define the target, the learners, the tasks and the resampling strategy.
The target is the temperature, and the resampling strategy is LOOCV (Leave-One-Out Cross Validation).
Features are the explanatory variables used to build models. I defined learners and tasks in consequence.
I used Multiple Linear Regression as a learner, the only one I need in the context of my internship.
Tasks were defined like this :
I selected all features (Digital terrain model, Corine Land Cover, solar irradiance)
I computed the linear correlation between temperature and each feature independently for every hour
I selected solar irradiance as a mandatory feature to build the models
For each hour, I selected the feature with the better linear correlation
These two features were the new tasks for every hour
The performance of these models were measured with RMSE (Root Mean Square Error) and this approach gave me an error of 1.61. Running a benchmark with more data will reduce this error.
Find below an example of an output realised with this method : this is an output for one hour (2018-05-02 14:00:00) where the model was built from a combination of solar irradiance and altitude.
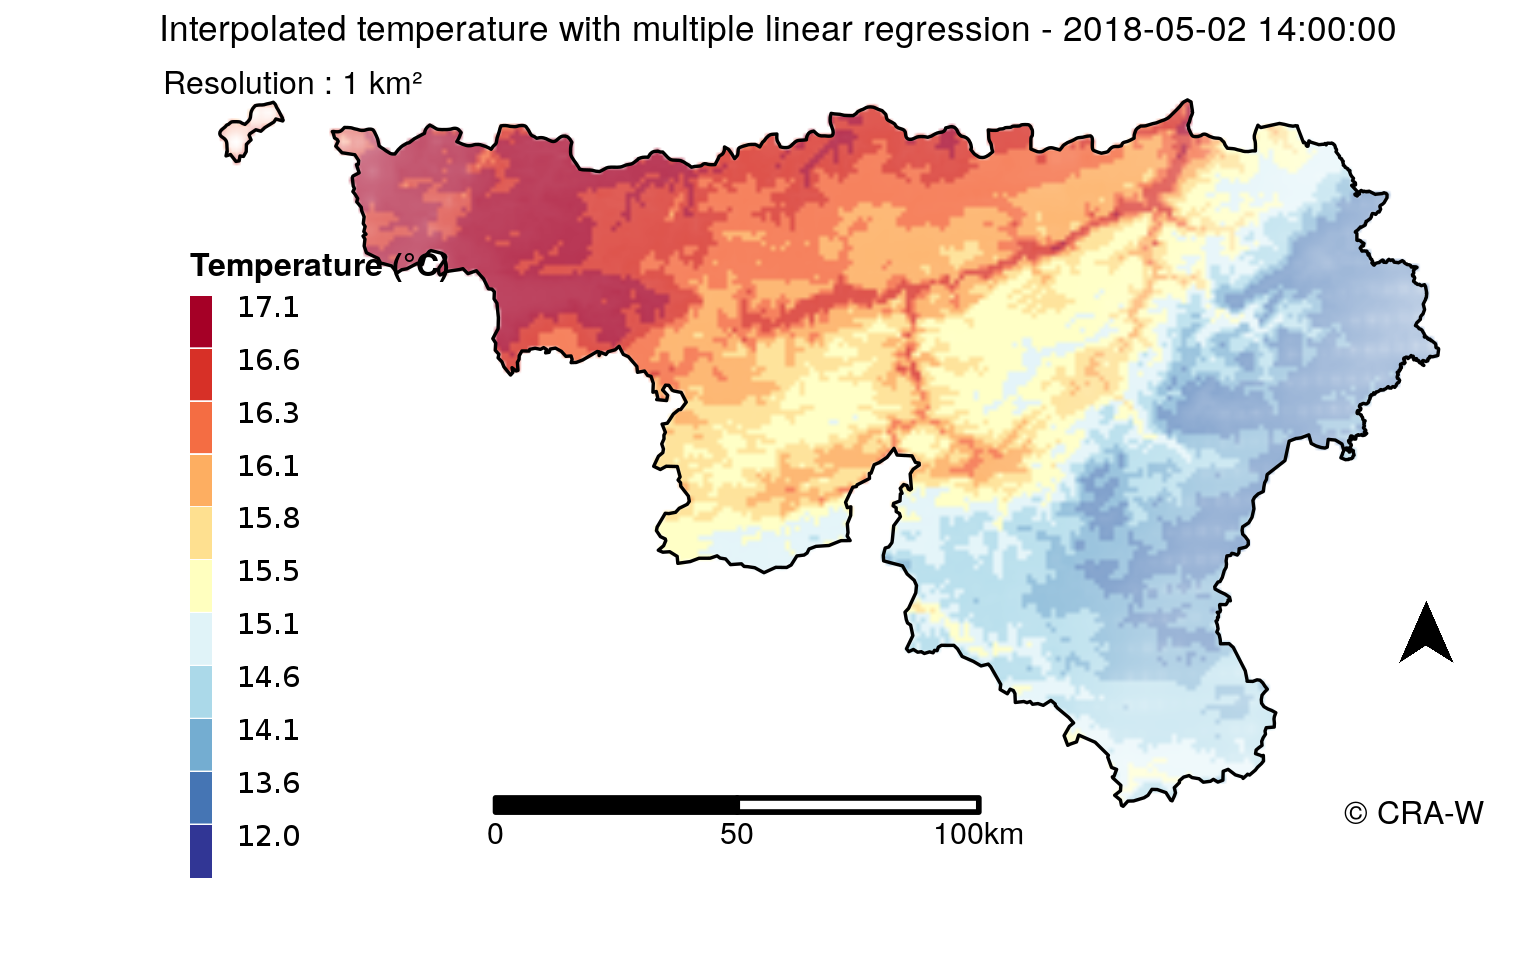
The equation of the model is :
Temperature = 15.33143 - 0.006450155.Altitude + 0.002454031.SolarIrradiance
Comparison of tasks
My approach has a limit, several models are built according to the hour. However, the first idea of the project was to build one unique model applicable to every hour.
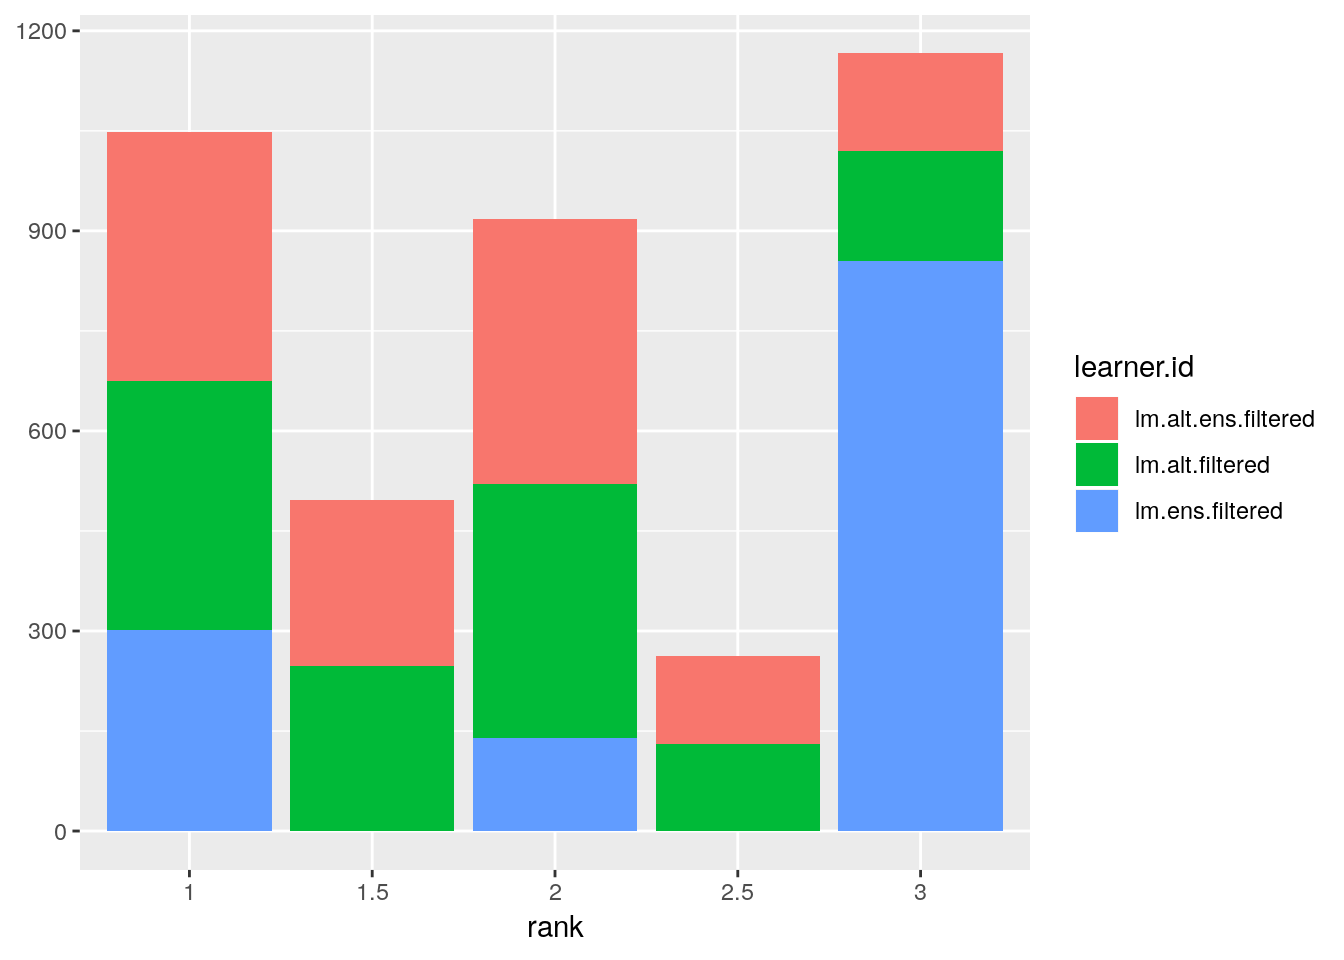
That’s why I compared different combinations of explanatory variables applied on the period. I compared 3 cases :
Altitude (alt)
Solar irradiance (ens)
Altitude + Solar irradiance (alt.ens)
To do that, I fused learners with filter methods where I selected the features to use.
Below, the comparison of rank of the three combinations. We observe that “Altitude” and “Altitude + Solar irradiance” are more precise than “Solar irradiance”.
The next plot shows the RMSE for every hour and for each combination of explanatory variables. It is an interactive plot, then you can zoom and observe more precisely points.