In the course of my studies in Bordeaux Sciences Agro, I realised a 3-month internship. This internship took place in the Walloon agricultural research centre (CRA-W)) from May 22nd to August 20th 2018. I made a contribution to the AGROMET project in Farming Systems, Territory and Information Technologies Unit. The aim of the Agromet project is to provide a near real-time hourly gridded datasets of weather parameters at the resolution of 1 km² for the whole region of Wallonia characterized by a quality indicator. My role in the project was to implement some spatialization methods for meteorological data. In particular, I used multiple linear regression to build a model which predict temperature from explanatory variables. The performance of the model has been evaluated through statistical tests.
Presentation of the AGROMET project
Context
The European directive 2009/128/CE imposes member-states to set up tools that allow for a more rational use of crop protection products. Among these tools, agricultural warning systems, based on crop monitoring models for the control of pests and diseases are widely adopted and have proved their efficiency. However, due to the difficulty to get meteorological data at high spatial resolution (at the parcel scale), they still are underused. The use of geostatistical tools (Kriging, Multiple Regressions, Artificial Neural Networks, etc.) makes it possible to interpolate data provided by physical weather stations in such a way that a high spatial resolution network (mesh size of 1 km2) of virtual weather stations could be generated. That is the objective of the AGROMET project. Moreover, some CRA-W’s units and other partners are interested in to build models against crop diseases like potato late blight or orange midge which depends on meteorological conditions.
Objectives
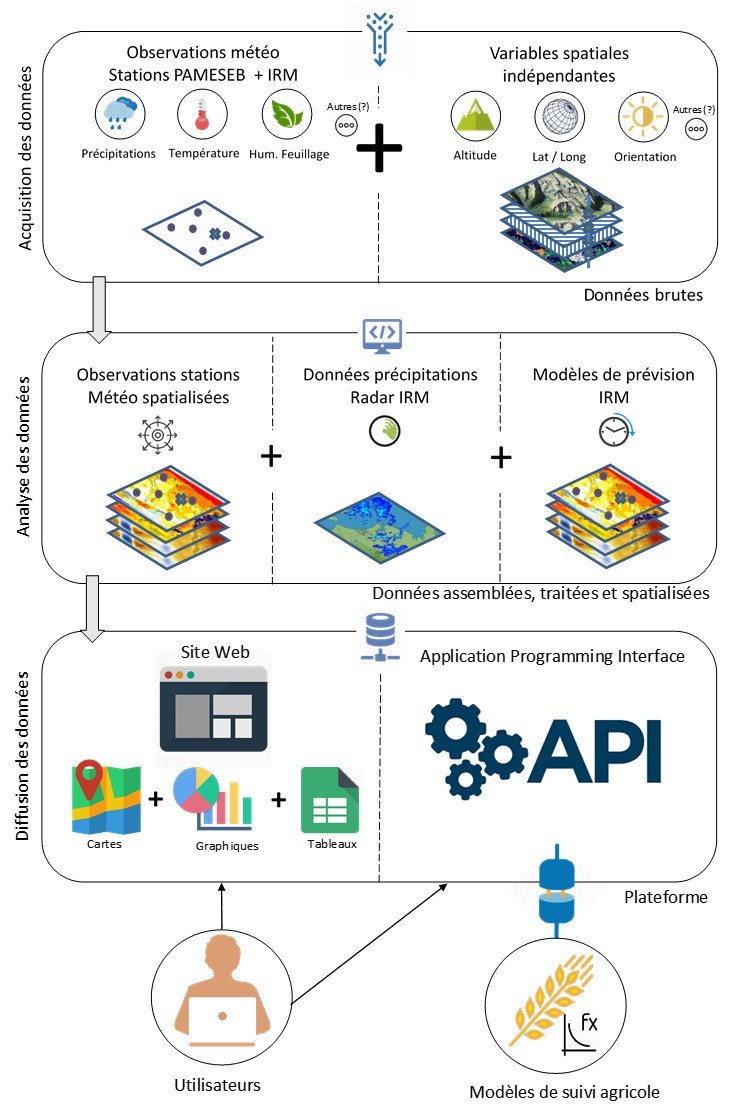
The project aims to set up an operational web-platform designed for real-time agro-meteorological data dissemination at high spatial (1km2) and temporal (hourly) resolution. To achieve the availability of data at such a high spatial resolution, we plan to “spatialize” the real-time data sent by more than 30 connected physical weather stations belonging to the PAMESEB and RMI networks. This spatialization will then result in a gridded dataset corresponding to a network of 16 000 virtual stations uniformly spread on the whole territory of Wallonia. These “spatialized” data will be made available through a web-platform providing interactive visualization widgets (maps, charts, tables and various indicators) and an API allowing their use on the fly, notably by agricultural warning systems providers. An extensive and precise documentation about data origin, geo-statistic algorithms used and uncertainty will also be available.
Meteorological data wanted to be predict are :
Temperature (1.5m above the ground)
Relative humidity (1.5m above the ground)
Leaves wetness
Rainfall will be spatialized from RMI rain radar data.
To predict these variables, known data are used :
Digital elevation model and its derivatives like aspect and slope
Solar irradiance
Other variables discussed to improve the prediction : distance to sea, CORINE land cover…
Agromet
Objectives of the internship
My work was focused on the prediction of the temperature. I ran a benchmark experiment where different desired regression learning algorithms are applied to various regression tasks (i.e. datasets with different combinations of explanatory variables and the target weather parameter) with the aim to compare and rank the combinations of algorithm and used explanatory variables using a cross validation resampling strategy that provides the desired performance metrics. And then, I aggregated, by calculating the mean, all the hourly performance measures to choose the method that globally performs the best. For each desired hourly dataset, I applied the choosen method to build a model to make spatial predictions. The predictions and their uncertainty have been vizualized using maps. Finally, I had to make the predictions available on the platform together with its uncertainty indicator.